Home
About
Research
Climate change and Texas coastal stream communities
MarineGEO Texas Bio Blitz
Green Bay benthic habitat/Hexagenia re-ecesis
Laguna Bacalar-Stromatolites, mussels, human impacts
USACE Artificial Habitat Bio Assessment-Milwaukee Outer Harbor
Australian Redclaw crayfish aquaponics
Teaching
Biology 120
Community Outreach
Divemaster Work
C.V.
Contact
Menu
Chris Groff, M.S.
Aquatic Ecologist, Ph.D. Student
Home
About
Research
Climate change and Texas coastal stream communities
MarineGEO Texas Bio Blitz
Green Bay benthic habitat/Hexagenia re-ecesis
Laguna Bacalar-Stromatolites, mussels, human impacts
USACE Artificial Habitat Bio Assessment-Milwaukee Outer Harbor
Australian Redclaw crayfish aquaponics
Teaching
Biology 120
Community Outreach
Divemaster Work
C.V.
Contact
×
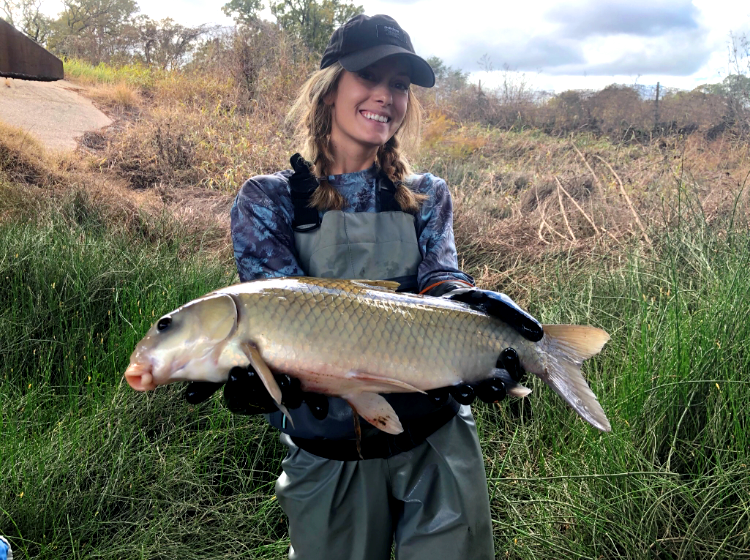
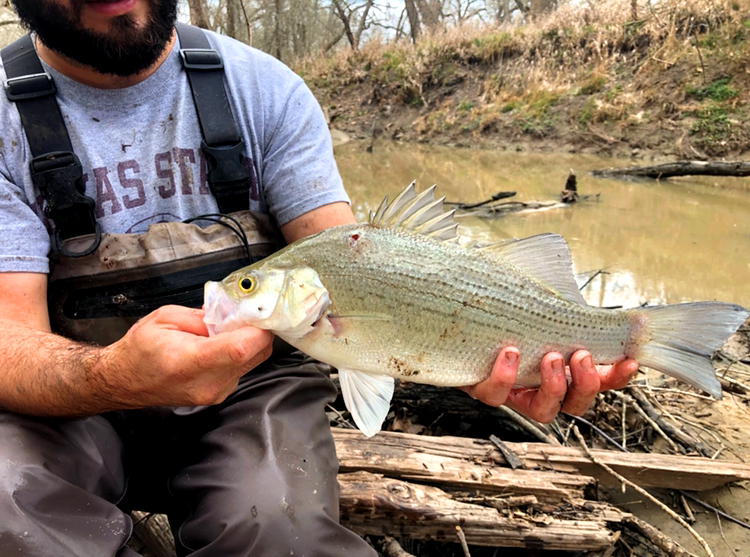
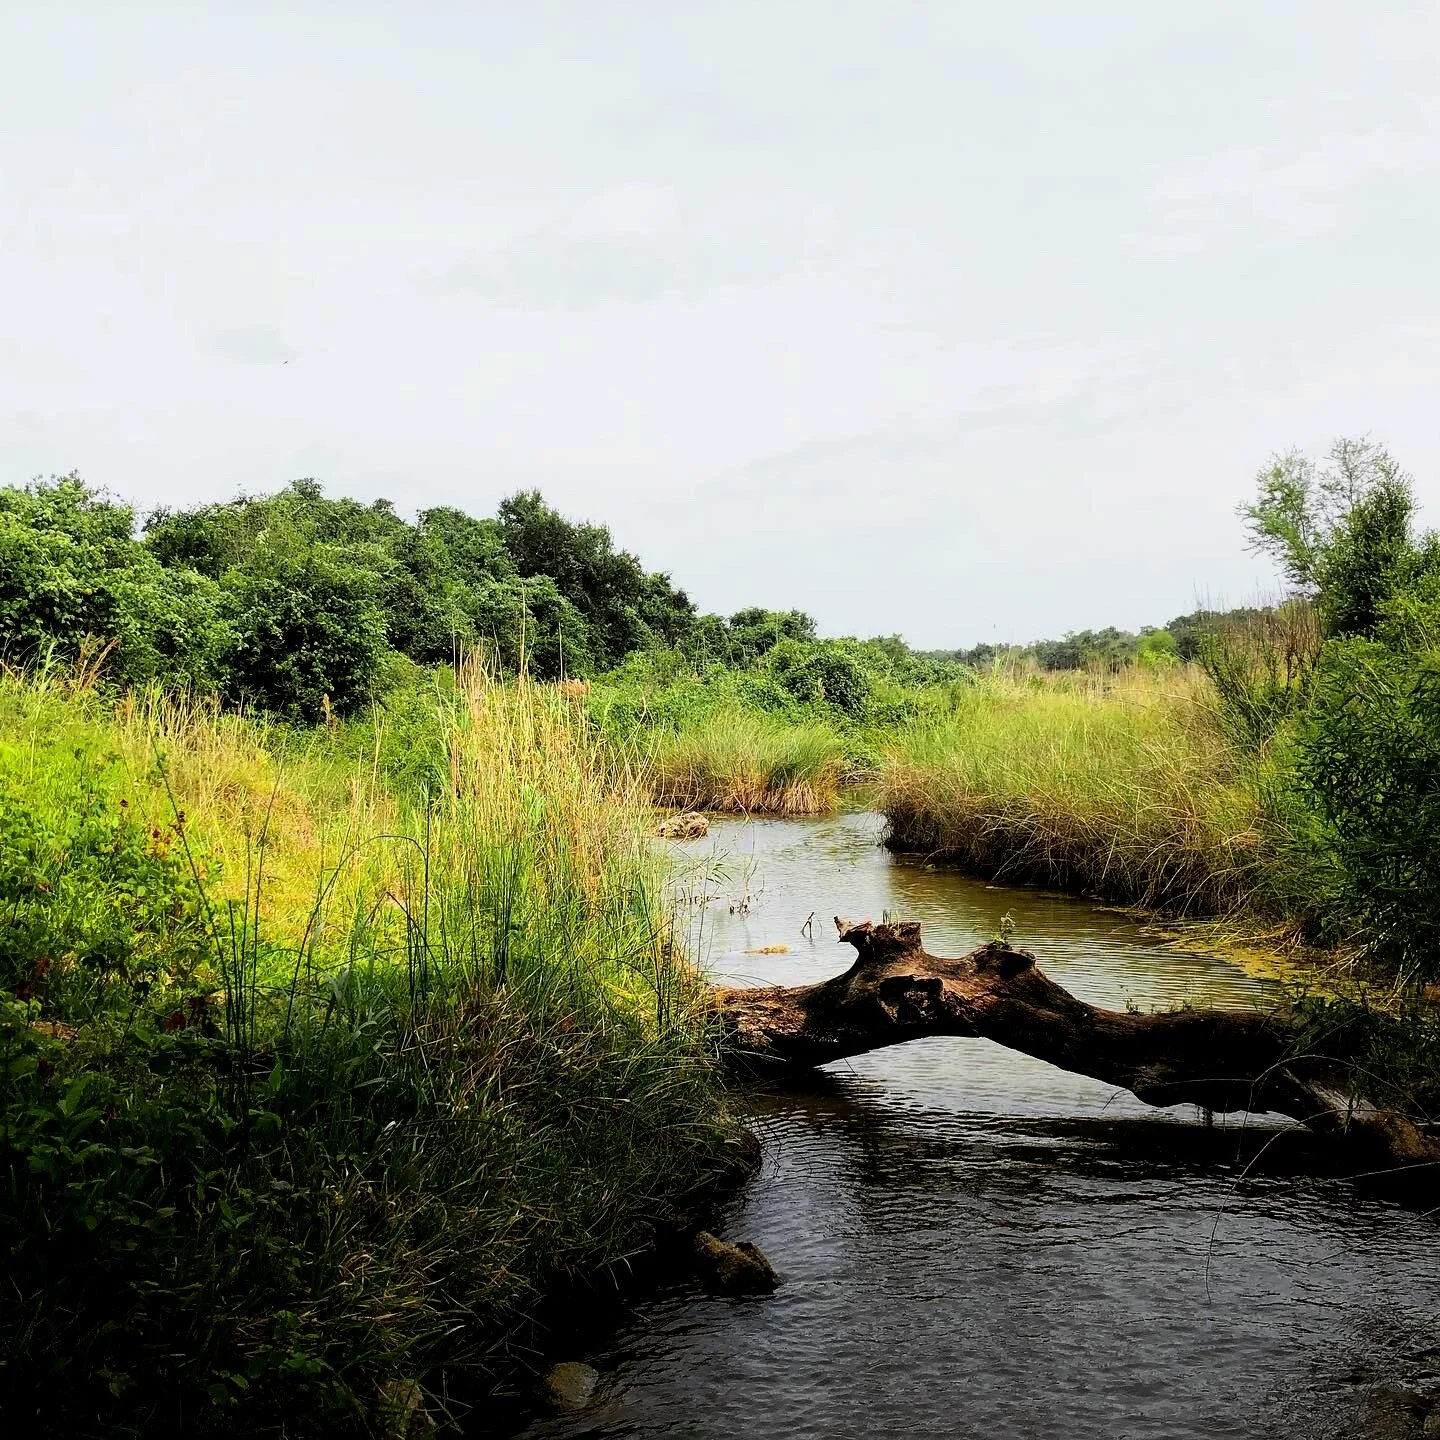
Does annual rainfall drive fish community assembly and food web structure in Texas coastal streams? Implications for a changing global climate?
*page currently in progress